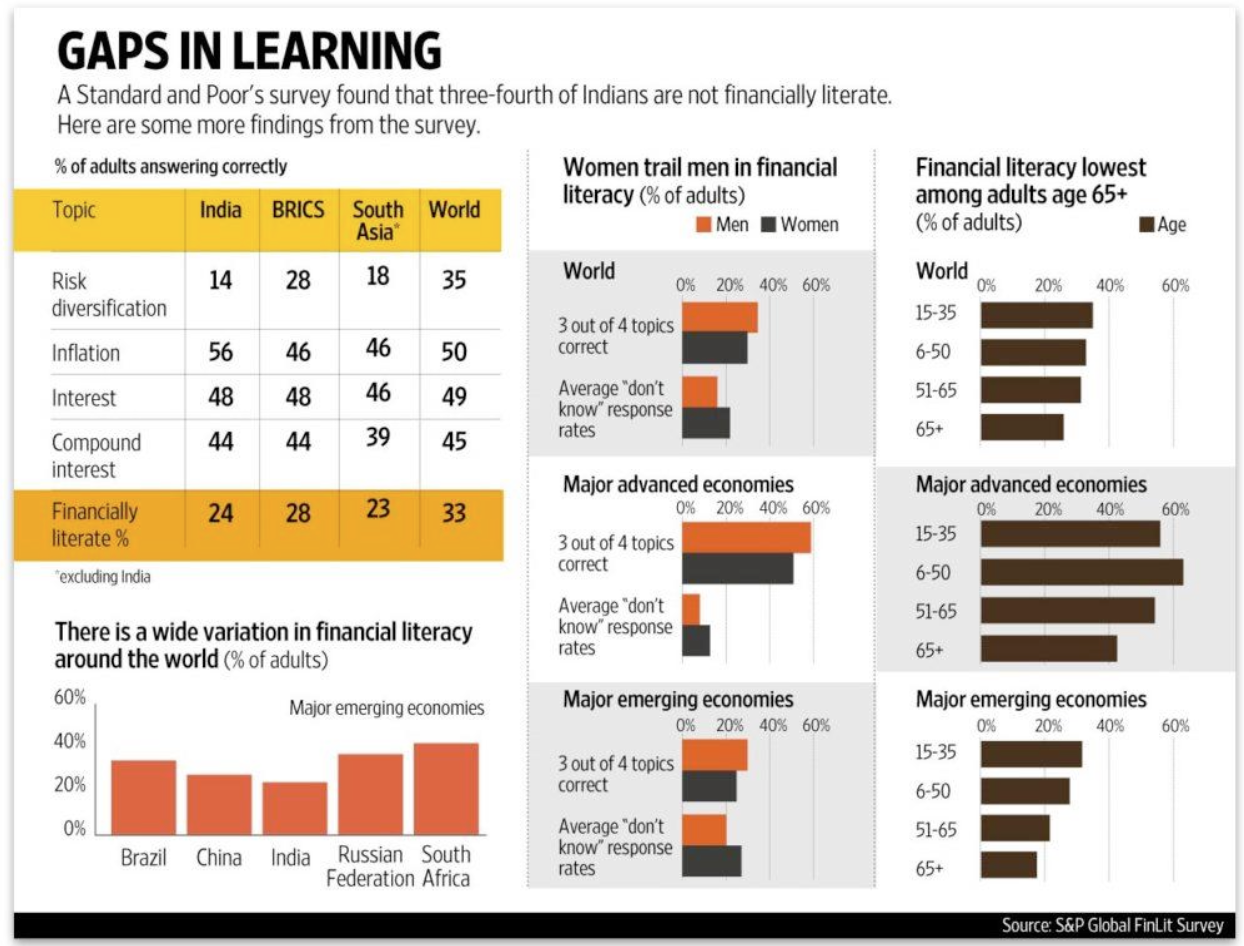
8. What does the figure describe?
A. Comparison of financial literacy rates among different age groups
B. Financial literacy rates across different countries
C. Financial literacy trends in the main emerging economies
D. Gender-based comparison of financial literacy rates in India
9. According to the figure, which of the following is true?
A. The majority of Russian adults grasp the basics of risk diversification.
B. The largest percentage of people who understand inflation is in India.
C. Of all the topics tested, South Asia has the lowest rate of literacy.
D. South Africa shows lower financial literacy rates compared to Russia.
10. is implied in the figure that …
A. the middle-aged have the highest rate of financial literacy worldwide.
B. the financial literacy rates among men and women worldwide do not differ significantly.
C. the elderly have a financial literacy percentage of over 50% in all developed countries.
D.interest rates are universally understood better than inflation.